Benchmarking of ISC metrics
1 Benchmarking of ISC metrics
This tutorial summarizes the benchmarking framework used to evaluate Inter-Sample Consistency (ISC) metrics for cell type annotation quality in scRNA-seq.
Each ISC metric returns one scalar score per cell type. Higher values indicate stronger inter-sample consistency, meaning that cell type definitions are more reproducible across donors or samples.
Because ISC is built on cross-sample dissimilarity, donor-to-donor variability is part of the metric definition rather than a downstream confounder.
2 Evaluation framework: 8 tasks
To systematically compare ISC behaviors, the benchmark defined eight evaluation criteria (tasks), each designed to probe a different failure mode or robustness property:
- sensitivity to cell type signal degradation by progressively shuffling original labels
- sensitivity to cell type over-partitioning by artificially splitting populations
- robustness to annotation granularity (coarse vs fine labels)
- robustness to cellular complexity (low vs high inter-cell-type variability tissues)
- robustness to number of samples
- robustness to cells per cell type
- robustness to batch effects
- robustness to biological perturbations (condition-induced shifts)
For each task, metric performance was summarized with a normalized task performance score from 0 (worst) to 1 (best), enabling direct comparison across tasks.
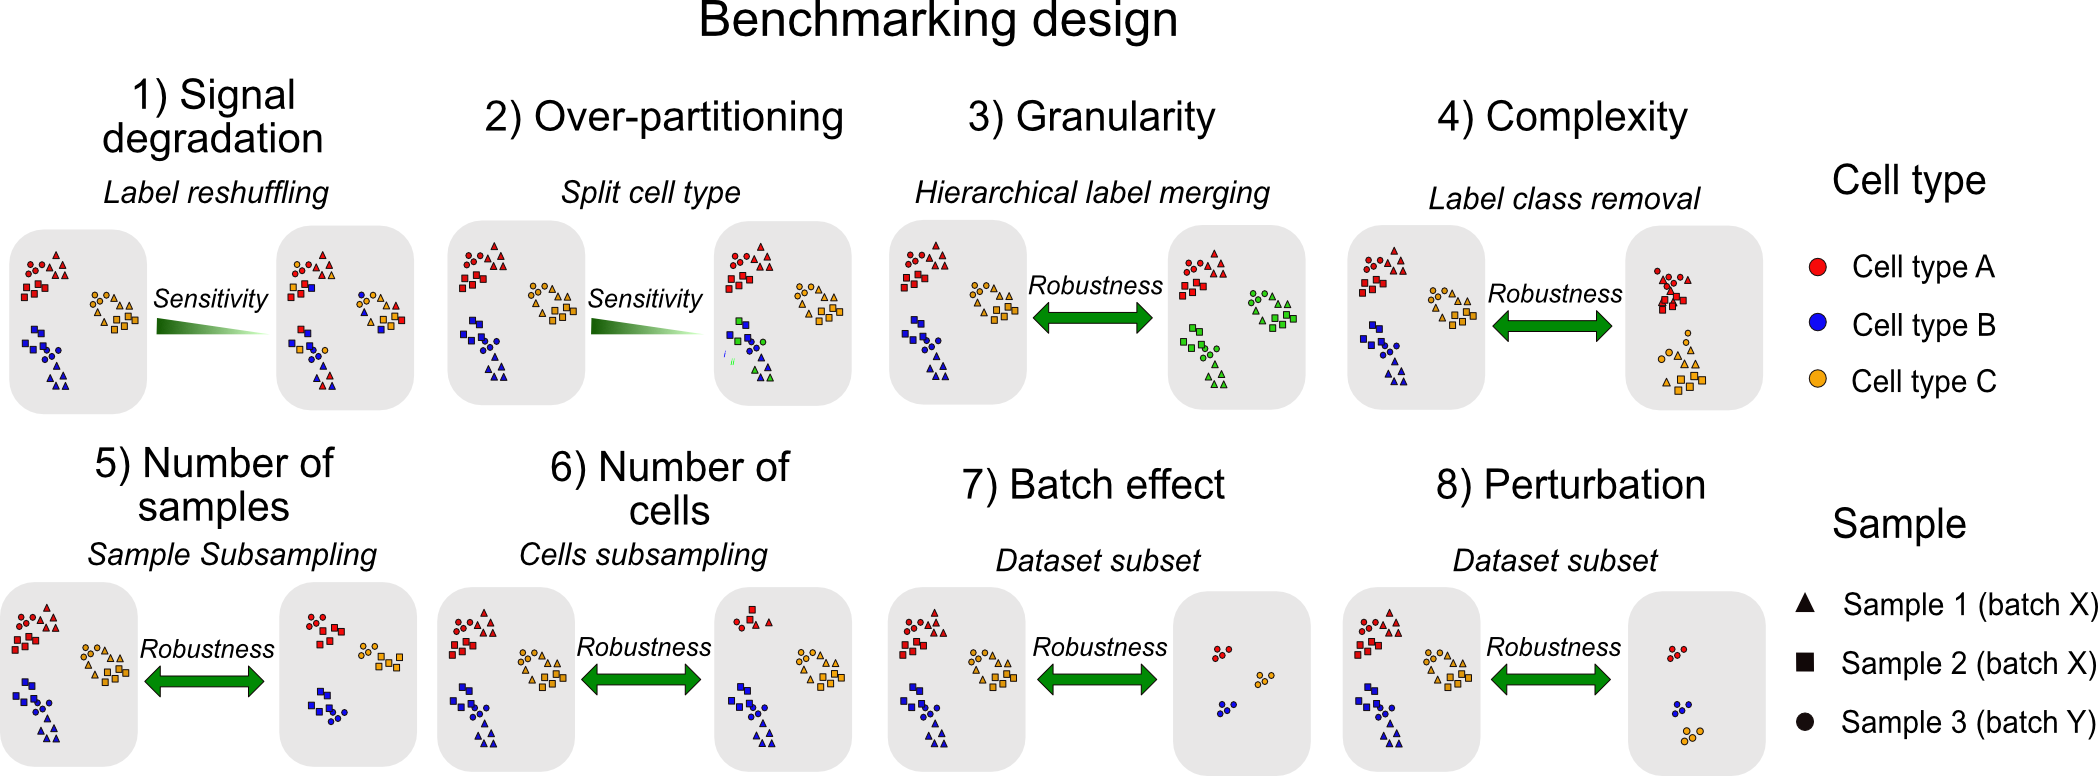
3 Benchmark design across real datasets
The benchmark evaluated:
- 6 ISC metrics
- 6 dissimilarity functions
- 31 scRNA-seq datasets
- 17 studies
- 6 biological systems (blood, colorectal cancer, melanoma, breast cancer, basal cell carcinoma, respiratory tissue)
Each dataset represented one batch and a relatively homogeneous biological condition. This reduced strong confounding from large batch/condition structure in baseline comparisons.
The eight tasks were then generated through controlled perturbations or combinations of these datasets to produce semi-synthetic scenarios with known changes in annotation quality, composition, batch structure, and biological heterogeneity.
4 Main benchmark outcomes
4.1 Global ranking
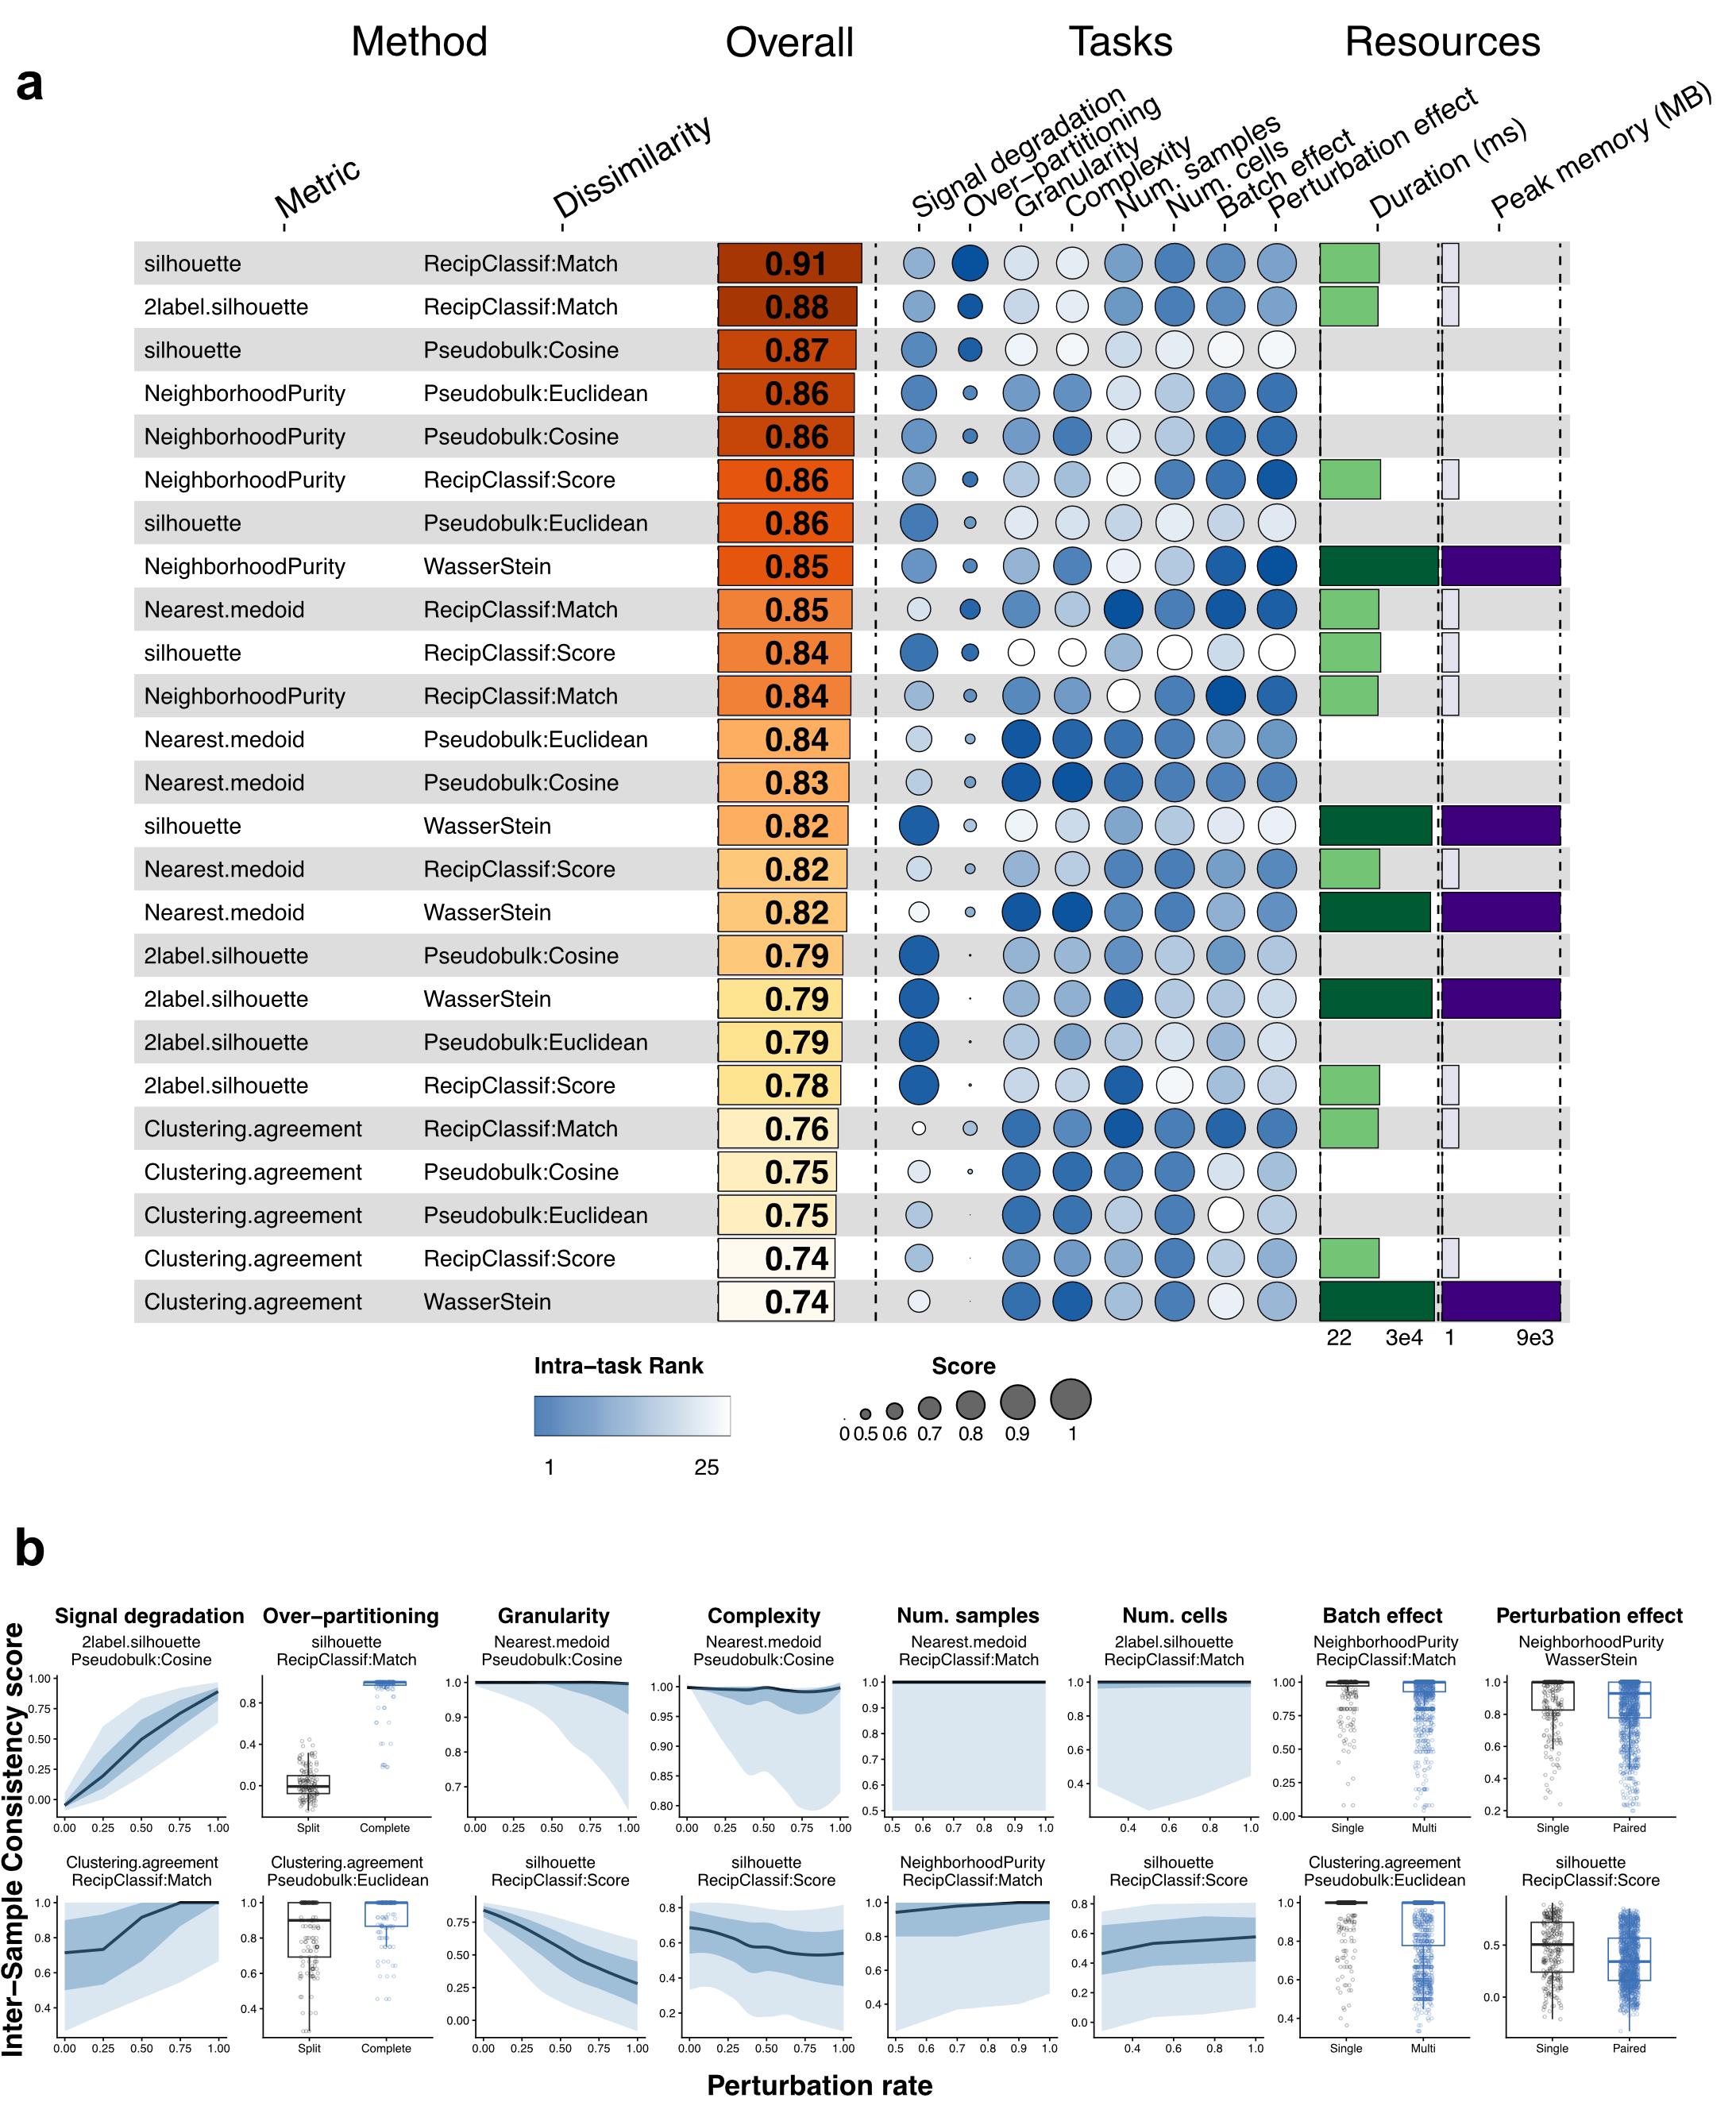
A global ranking across tasks identified the top-performing metric+dissimilarity combinations as:
- silhouette + RCM
- 2-label silhouette + RCM
- silhouette + pseudobulk cosine
This indicates that silhouette-family ISC scores provide the best overall balance of sensitivity and robustness, especially when paired with reciprocal classification matching (RCM).
4.2 Efficiency and scalability
Pseudobulk-based methods were markedly more efficient than distribution-based distances:
- typically under 1 second per dataset
- typically less than 100 MB memory
Wasserstein distance performed competitively in some tasks, but its higher runtime and memory demands did not improve overall benchmark ranking enough to offset the computational cost.
5 Decomposing metric and dissimilarity contributions
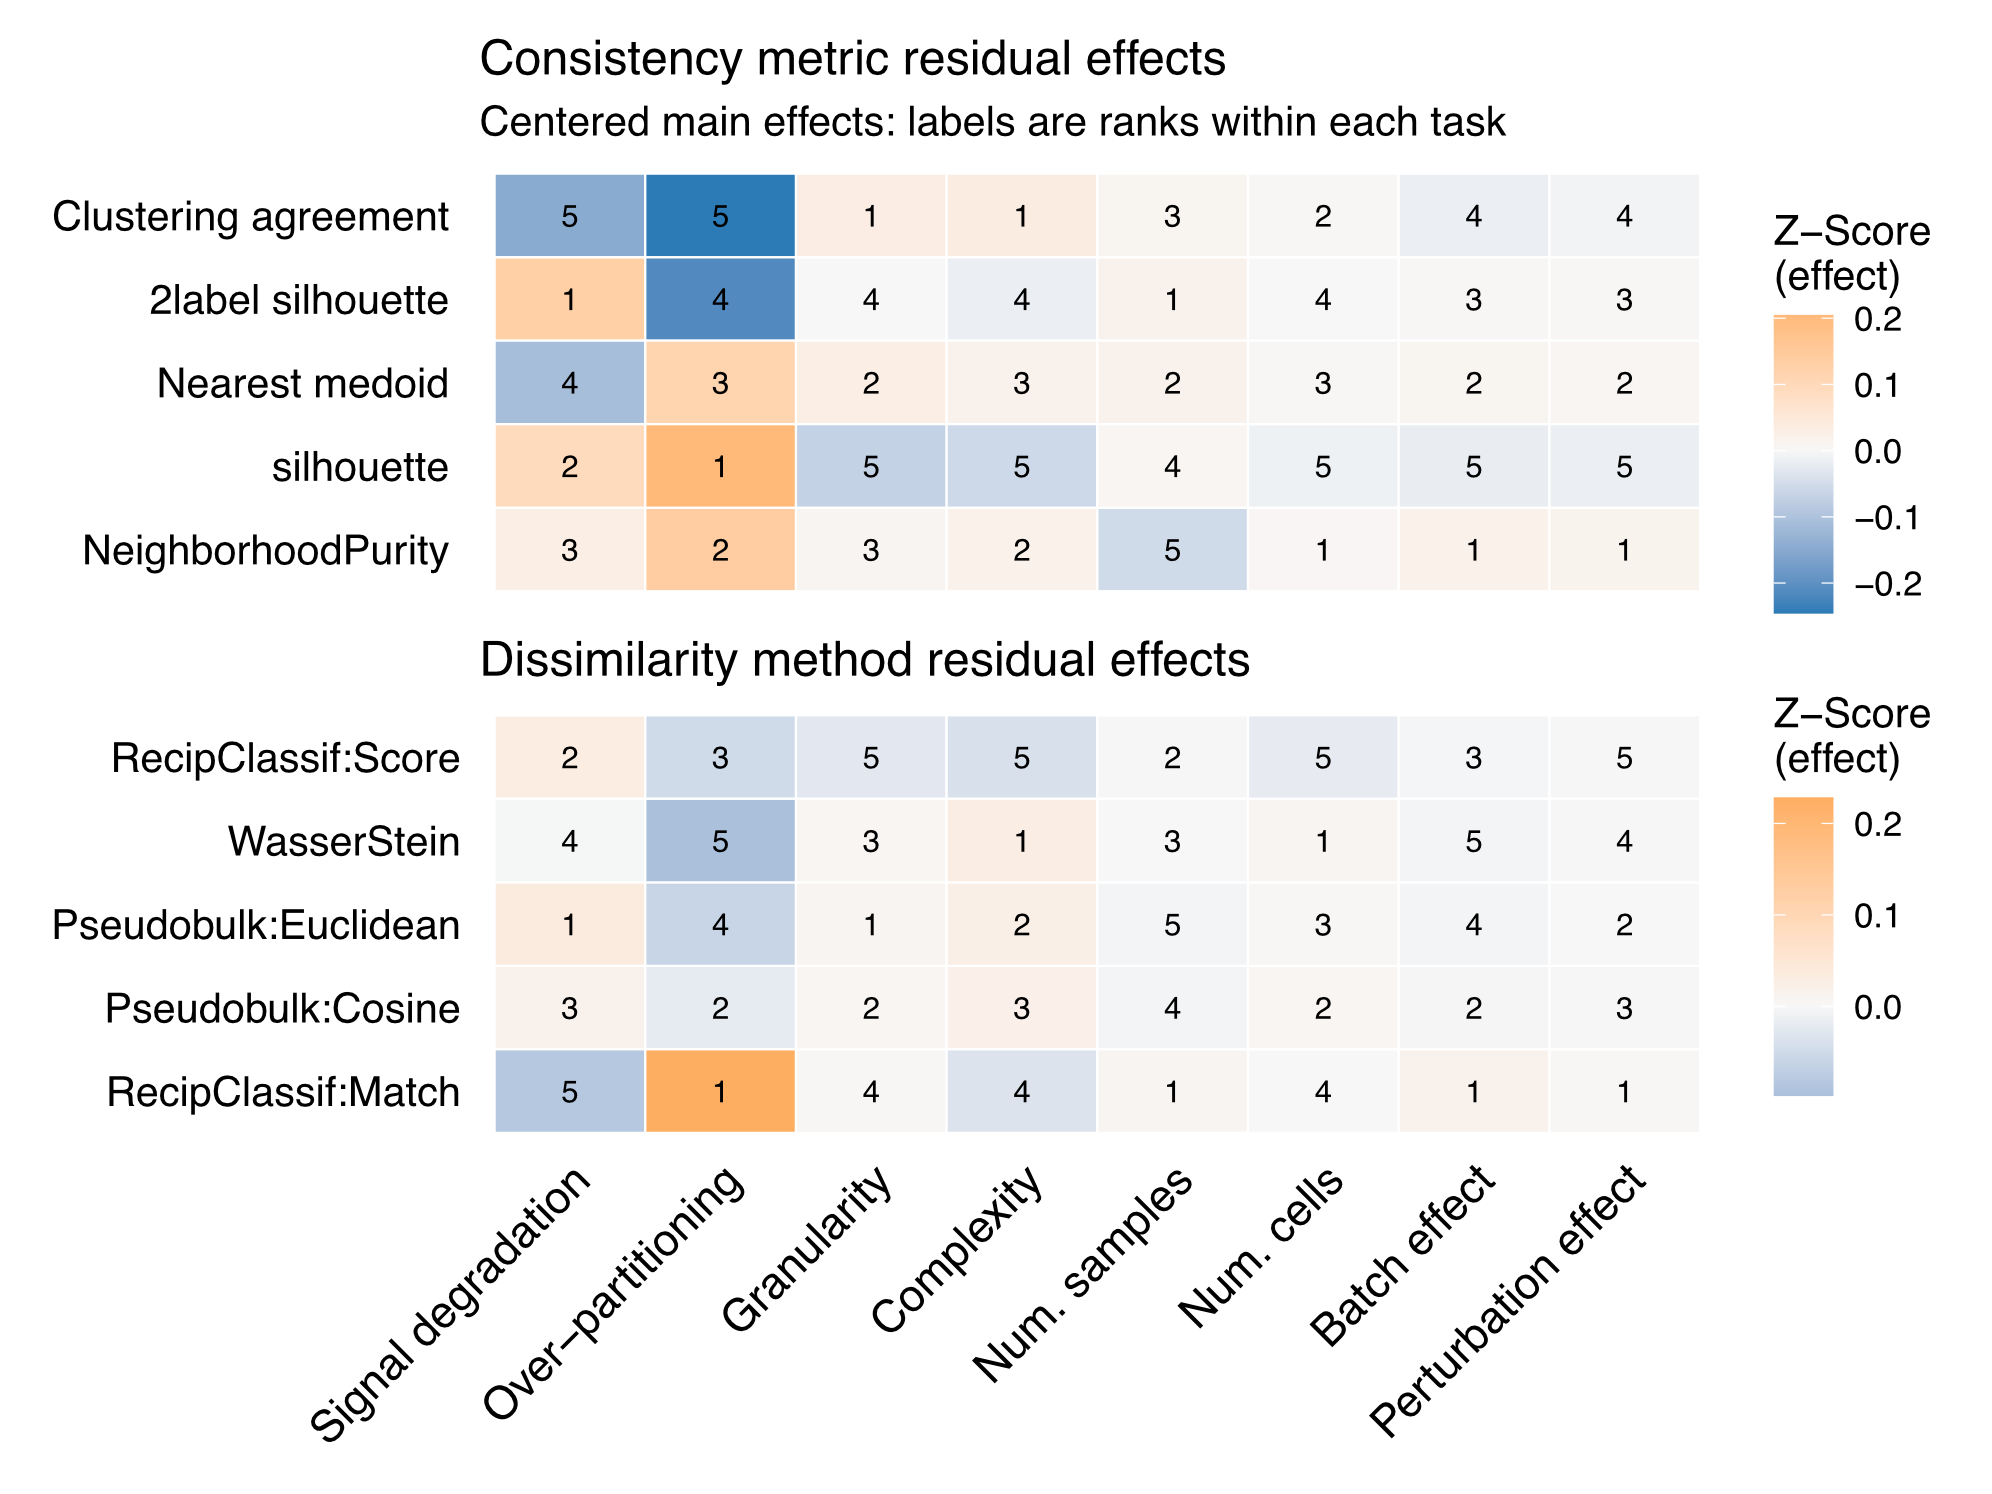
To separate scoring-function effects from representation effects, benchmark performance was decomposed into marginal contributions.
Key findings:
- 2-label silhouette contributed most to task 1 (signal degradation sensitivity)
- silhouette contributed most to task 2 (over-partitioning sensitivity)
- RCM dissimilarity performed best for task 2 and for robustness to batch/condition shifts (tasks 7 and 8)
- pseudobulk cosine and Euclidean dissimilarities performed best for task 1
These results support two complementary ISC dimensions:
- task-1-oriented dimension: best captured by 2-label silhouette + pseudobulk cosine
- task-2-oriented dimension: best captured by silhouette + RCM
Most methods were robust to granularity, cellular complexity, sample number, and cells per cell type. Neighborhood purity was the main exception when sample count approached neighborhood size.
6 Stability of ranking with dataset subsampling
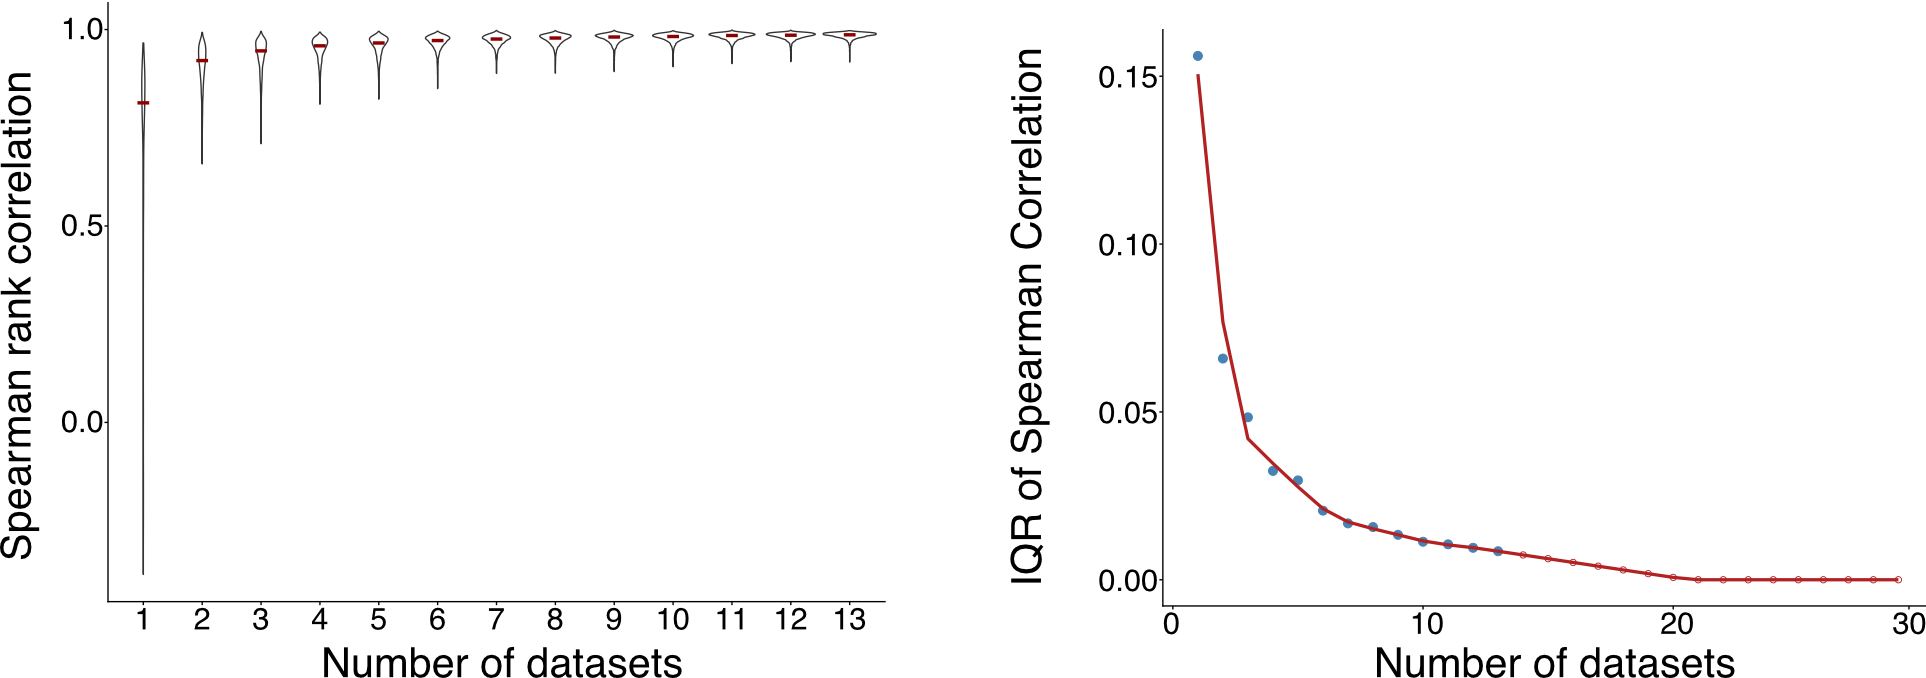
To test robustness to dataset selection, ranking stability was evaluated across progressively larger subsets of datasets.
- rank agreement increased with subset size
- median correlation plateaued near 0.95 by 10 datasets
- changes were minimal beyond that point
This supports that the 31-dataset benchmark is sufficient to produce stable, representative metric rankings.
7 Practical recommendations
From the benchmark, two combinations are especially useful in practice:
- global-structure sensitivity: 2-label silhouette + pseudobulk cosine
- local-structure / over-partitioning sensitivity: silhouette + RCM
Using both provides complementary evidence when diagnosing annotation consistency problems across samples.
8 Take-home message
The benchmarking analysis identifies ISC metric configurations that are both robust and broadly transferable across biological systems, evaluation tasks, and dataset settings. This provides a practical and quantitative basis for evaluating and improving scRNA-seq cell type annotations.